
Google Analytics Guide For Beginners

Google Analytics is definitely the industry standard when it comes to digital analytics and analysing online (and offline) behaviour. Over 10 million websites use GA (Google Analytics) to review their statistics. It’s free and people from all skill levels can use it relatively easy. This is my ”beginners introduction” to Google Analytics, starting with basics and then digging in a little more into it’s powers.
First off Google Analytics is like the atlantic ocean, there’s almost nothing you won’t be able to analyse with it (data nerds wet dream). However, the bad side to this is that it’s often overwhelming to starters. We will start by looking into the basic data reports you automatically get after you’ve integrated Google Analytics in your website or webshop. After that we will piece by piece start looking into the more techy stuff to give you an idea of the powers this analytical software can give you as an marketer or analyst.
The basic Integration
The ”installation” of Google Analytics is quick and it shouldn’t take longer than a couple of minutes to install the basic script. The script should be installed in the Header file of the website which means that it will be running on every page of the website or application. Start by going to http://www.google.com/analytics/ and signup with your Gmail adress, there you can add your website / application and you will get the ”Universal Script” to install. If you are using Google Adwords PPC advertising it’s really simple to connect Adwords with Analytics, we’ll come back to that.
The basic data reports
Once you have installed the script in your website you’ve be able to see your data directly in Google Analytics from this point and forward. Let’s talk about the most basic reports.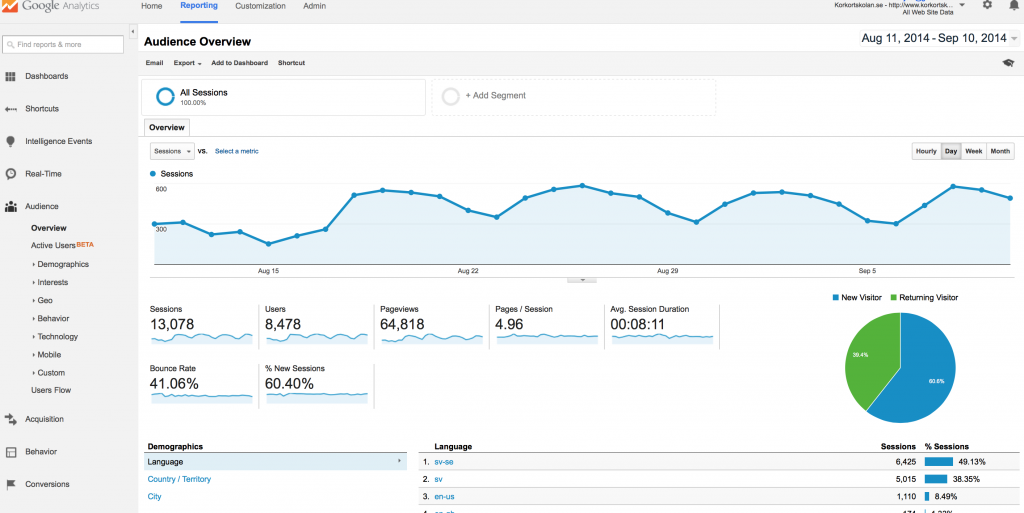
The screenshot above is the first dashboard you’ll see in Google Analytics. These below are the most fundamental parts of your basic knowledge.
Left side navigation:
Real-Time – See your visitors, traffic source and their behaviour in real-time.
Audience – Tells you more about who is visiting your website.
Acquisition – Tells you how your visitors found and arrived to your website.
Behaviour – Tells you what your visitors are actually doing in your website.
Conversions – Tells you more about your sales and conversion.
Audience Overview (For the past 30 days, can be changed in the upper right corner)
Sessions – When I enter a website I’m having one session on the website.
Users – Similar to Unique Pageview, an unique user of your website.
Pageviews – The total number of pages viewed on your site.
Pages/Session – The average number of pages viewed per session (visit)
Avg. Session duration – The average amount of time visitors stay on your
Bounce Rate – Percent of visitors that leave your site after viewing only one page.
% New Sessions – Percent of total visitors who arrived at your site for the first time
The difference between a session and users can be confusing. Here’s Googles take on it:
”The initial session by a user during any given date range is considered to be an additional session and an additional user. Any future sessions from the same user during the selected time period are counted as additional sessions, but not as additional users.”
Additional data you can view on the ”Audience Overview” page is:
Language
Country/Territory
City
Browser
Operating System
Service Provider
Mobile Operating System
Mobile Service Provider
Mobile Screen Resolution
Acquisition Overview 
Acquisition overview gives you important data of how you actually received the visitors and where they came from. In the example above 42.3% of all traffic came from organic search (Google searches), 29.3% from Paid Search (Google Adwords) and so on…
If you click on example Paid Search you will be able to see the different channels within this area, for example Google Adwords. And if you have linked your Adwords account with Analytics you will be able to see exactly which keywords are delivering traffic, conversions and how they behave on your website etc…
If we look at the ”Social” channel on the example image above we can actually see that this channel has one of the best ROI (Return On Investments) because it has lowest bounce rate and highest conversion rate to our goal. Of course this depends on the costs in our Social channel, but in this case it’s free (viral spread on ex. Facebook). And this channel is not really delivering a lot of traffic, but at least we are not paying for it. But just now, we actually came up with an insight which we can try out by example doing a social campaign on Facebook and then looking at the results.
Behavior Overview 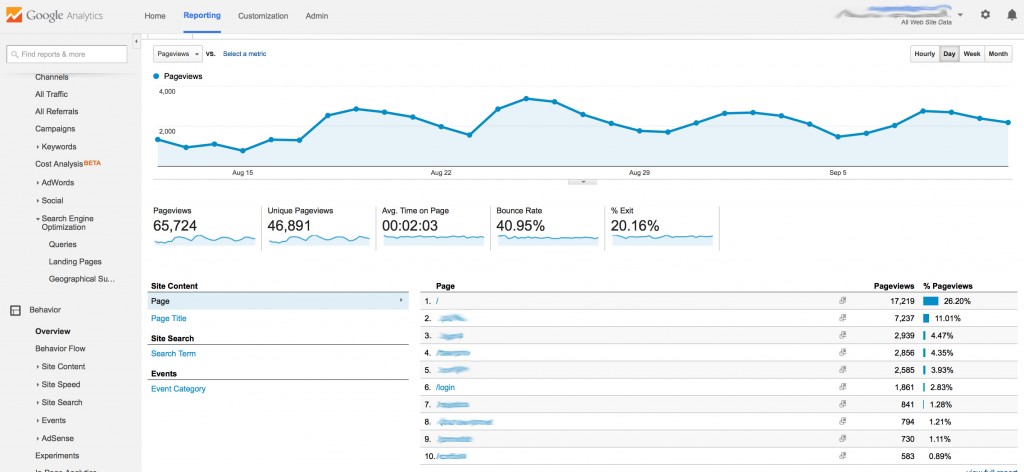
Behavior Overview is all about content and how people actually react on different pages on your website. This part is especially important within SEO and is used to understand what are the most popular pages on your website. We can also see which page has high bounce rate (This is usually an indication that your visitors were confused or that they didn’t find what they were looking for.) and left after only viewing one page on your website. We can find pages with high bounce rates and then our insight could be that we need to work with the content of these pages. Under Behavior we can find more metrics such as Site Speed (also important for SEO) and Site Search which can be very useful if you have a search box in your website and wan’t to know more what your users are actually searching for and so on. So it’s analysing the ”internal” search box if you have one in your site. If you wan’t to integrate ”Site Search” your search URLs most likely look something like this: ” yourwebsite.se/search?query=red+shoes ” The actual search term here is ”red shoes” and the function Google is asking for is ”query”, so this is the ”parameter” Google asks for when you want to enable site search. We won’t dive in too much in the technical parts for now. Overall the Behavior section in GA is useful for you to analyse and create a better user experience.
Real-Time Overview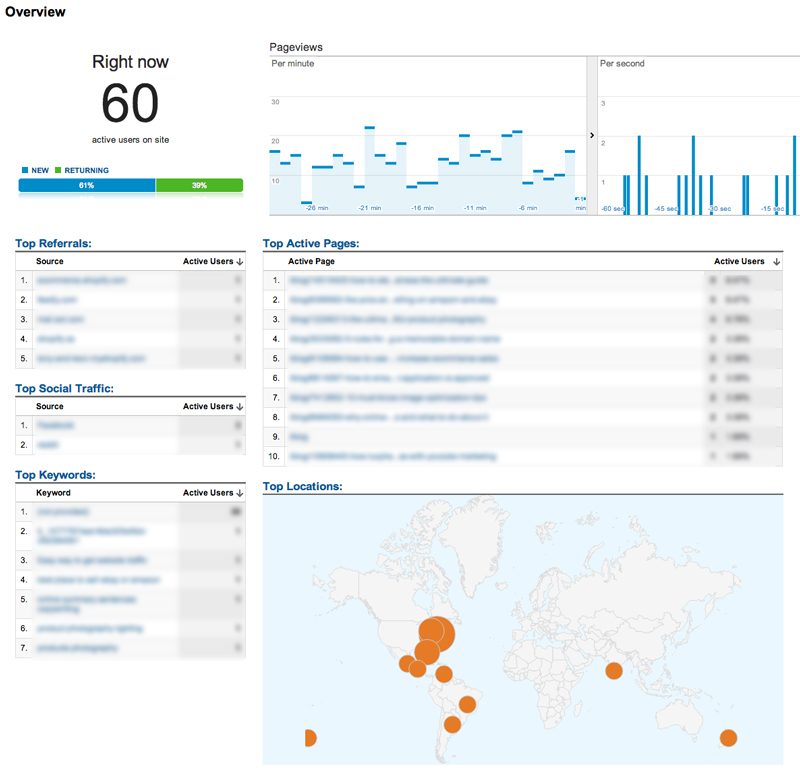
Real-Time overview gives you interesting data if you wan’t to monitor your website traffic as it happens in real time. You can see where they came from, for instance if they are ”Referral” traffic which means another website are sending you this traffic, example: a link or ad at someone else’s website. You can see what page they are browsing on right now and their geographical location. Real time is interesting but only useful at times, for instance if you have a one time TV commercial on right now or something else you wan’t to analyse in real time.
Defining your goals and questions
I mentioned earlier that the metrics Google Analytics provides you can seem overwhelming. Even more all the metrics you can manually add to it creates an endless flow of data about almost anything. It’s really important to remember that this information is useless if you don’t have any goals or questions. Defining what you wan’t to get out of it, and actually use the insight(s) you get to optimise is the key. I also mentioned that historical data is important to understand what is working and not. But for start-ups that don’t have any prior data to go on it’s mostly about throwing it out there and keeping an eye on your KPI Metrics. You can stare blind on the ”Real-Time” data or something else, but use questions such as: ”How many sales do we get from mobile users?”, ”How many sales did we get from mobile users last year?”, ”What channels are driving high conversion-rates on medium to low traffic?”
We can then use specific metrics to answer our questions and therefore get valuable insights we can turn into real actions.
Adding and comparing segments
One important way to break down the Google Analytics data is to use the segmentation. 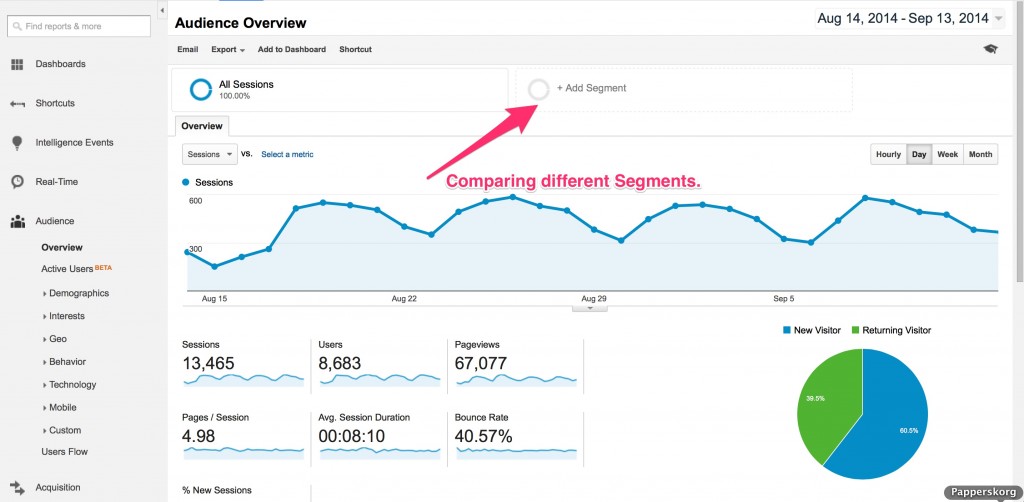
In the above screenshot you’ll know where to find the segmentation window. 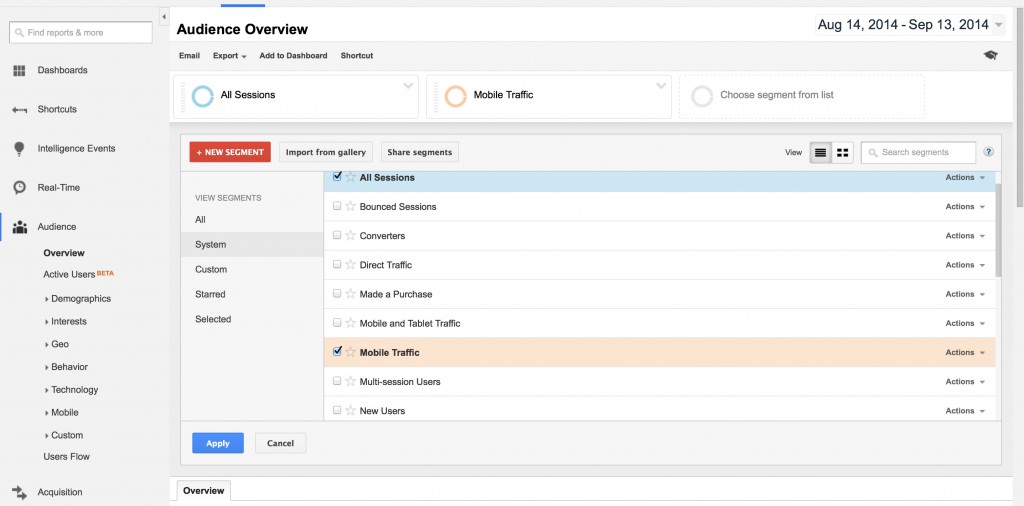
Let’s select ”Mobile traffic” and ”Converters”. 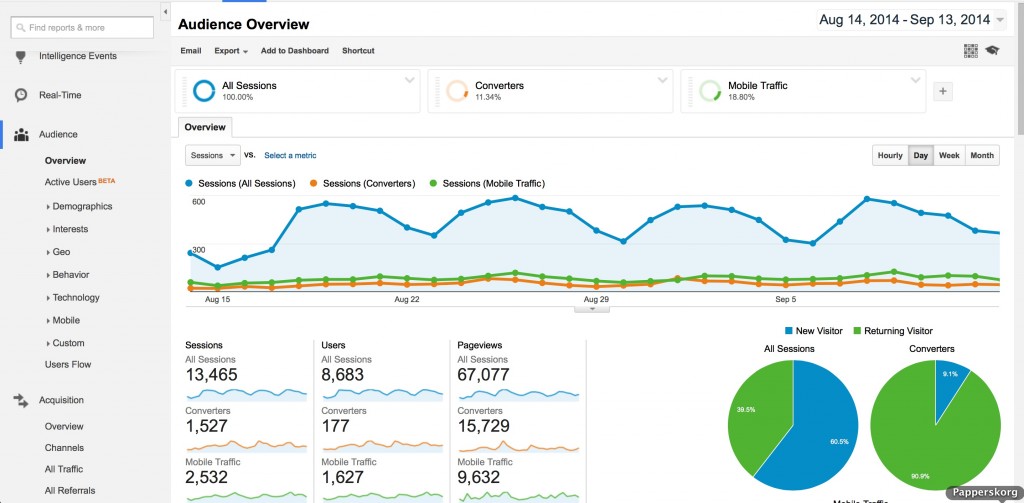
In the screenshot above we have selected ”Mobile traffic” and ”Converters” segment. Now we can compare total traffic, mobile traffic and converters (visitors who end up converting to a goal(in this case a sale)). The first insight I made from this was the fact that 90% of converters are returning visitors. So only about 1/10 of total users make a purchase on their first visit. Wonder why…
Conversion Overview (Goals & Ecommerce)
This brings us to a very big part of Google Analytics, measuring actual conversions such as eCommerce product sales or other goals that you wan’t to set up. 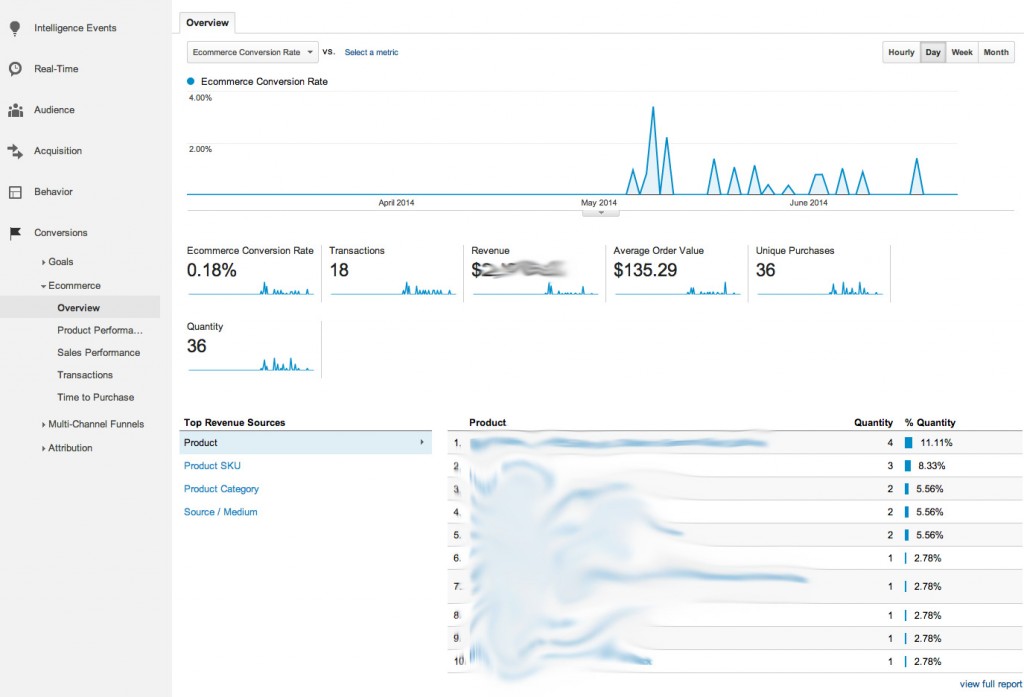
Above is an example Ecommerce overview with basic information such as conversion rate, transactions, revenue, average order value, unique purchases and quantity. Here we can get a very powerful overview of what products are selling good, which are selling bad, what categories are selling better than others and so on. For instance we can see ”Time to Purchase” which gives us the number of days and number of sessions it takes til the purchase actually happens.
Before we jump in to the integration process we have to talk about Google Analytics Goals, which are very simple to understand.
Google Analytics Goals 
Goals could for instance be specific events that happens on your website that you want to measure. In this example we have not set any value in money on the goals, but we just wan’t to know how many visitors reach the page /thank-you (which means the order is completed), this is ”Betald” in our example. Then we wan’t to know how many end up in /error (which happens when they enter wrong payment details or cancel during the check-out process).
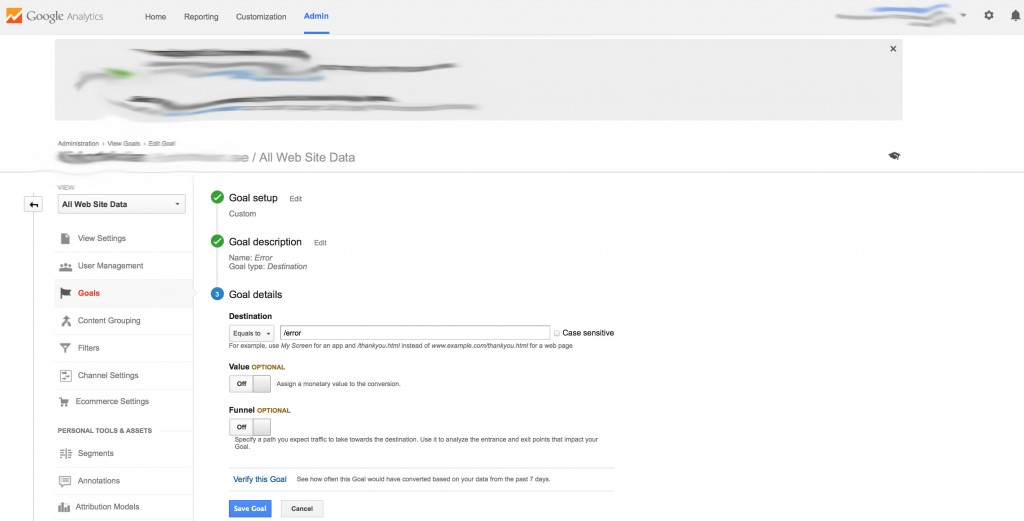
If you wan’t to set up your custom Goals you go to Admin –> Goals –> New Goal. For instance you can set up a goal when a visitor clicks on a telephone-number or when he reaches a certain page which we use in this case. So we have set up the goal with a destination page of /error. This means every time a visitor ends up in the /error page the ”goal conversion” is created. You can measure anything you wan’t, when people create an account, when they click on certain links and so on…
We have a client where we track phone-calls happened via the website. The code we use there is: < a onclick="_gaq.push(['_trackEvent', 'telefon', 'ring']);" href="tel:020121265">020-12 12 65< /a > – So in this case every time a visitor clicks on the telephone number in the website and wants to make a call directly via it we have a Google Analytics script that notices this via the ”trackEvent” function. In this telephone number example we can see all ”Telefon, Ring(Call)” events happened and can analyse these furthermore. This is a bit over the beginner level right now so I’ll talk more about Google Analytics Scripts (Code) later in this article.
Funnel Visualisation & Goal Flow
When you understand Funnel’s you understand your visitor/customers behaviour on your site, this is equal to power! A funnel is the visitors behaviour from entering the site to leaving the site, or more importantly the visitors behaviour from entering the shopping cart/product to finalising the check-out process. You can create your custom funnels.
Let’s take a look at a funnel visualisation: 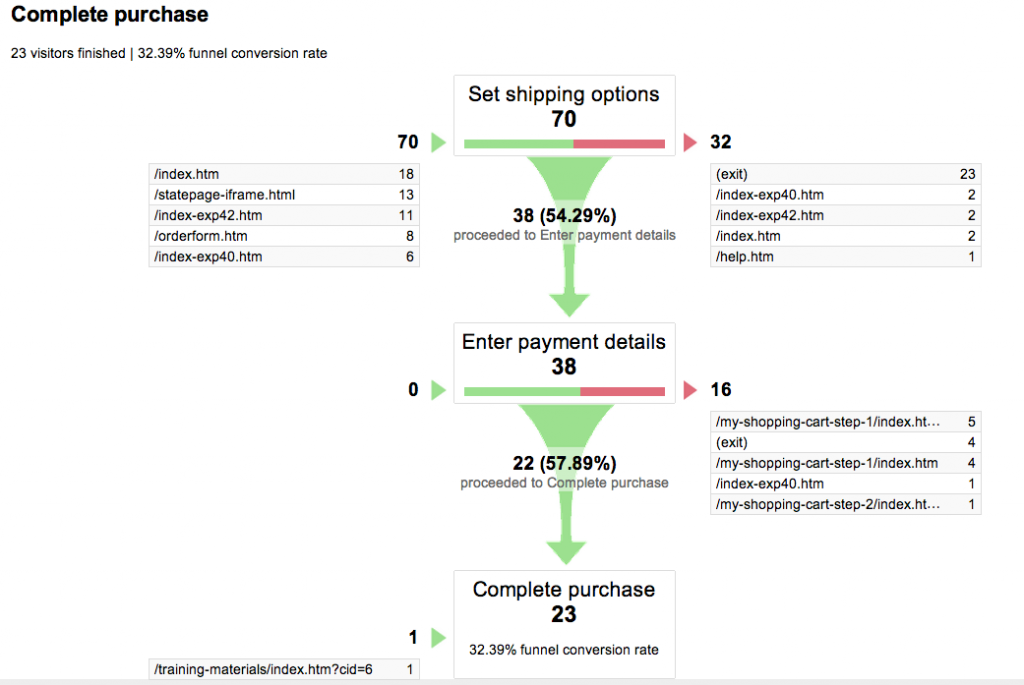
Basically this means that 70 People came to ”Set Shipping Options” page, then only 38 or 54.29% proceeded to ”Payment Details” page and from that 57.89% actually completed the purchase. So this funnel is the users flow from starting the order process at ”Shipping Options” (70 people) to the end ”Complete purchase” which only was 23 people from the 70. When you look further at this you understand where your users come from and at what point do they leave (and to where). You could get great insights here how to optimise the ”check out experience” so the rest 67.61% also would complete the purchase instead of leaving the site in middle of the process. Obviously this rate can never be 100%, there will always be people leaving your website before they place an order. But if you see a high drop at some stage you could analyse this further. Maybe there are too many fields in the shipping options page or this page is found confusing by your users? After some research and optimisation we probably can get better conversion here and eventually more money in our pocket!
Goal Flow
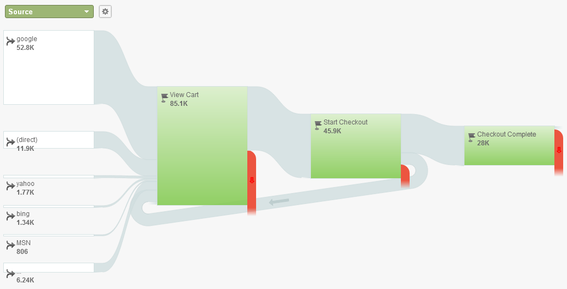
Goal Flow is more or less the same thing as Funnel Visualisation. This is interesting if we have other Goals than only eCommerce. In the above image we can see where people came from to our site, example 52,8K came from Google, then we can see where people leave (the red color) at each step. Here we start the flow from ”Source” which means the traffic source to the website and end at eCommerce checkout complete. In the ”Source” list in the upper left corner there’s a lot of different options and you may also create ”Custom Variables”. Custom Variables are very interesting and a bit techy, with some coding you can track anything you wan’t to. Read more about custom variables here. Or read more about the difference between Funnel’s and Goal Flow here.
Just some example’s on Custom Variables so that you understand it’s powers:
Track The Visitor ID
Google Analytics doesn’t let you put in personally identifiable information, but it’s generally held that random visitor id’s that you can then compare with your own database outside of GA, are ok. so this way you can track the same visitor even when they’re not logged into your site. (Just imagine for a minute what you can do with this!)
_gaq.push([‘_setCustomVar’,1,’UserID’,’1234567890′,1]);
And:
Track Who Comments
Commenters are more likely to return to your site, and are more engaged. Track a default value of no on the visitor until they comment, they record they’re a commentor, and you can watch the behavior of these two types of users across the site.
_gaq.push([‘_setCustomVar’,4,’Commented’,’Yes’,1]);
_gaq.push([‘_setCustomVar’,4,’Commented’,’No’,1]);
With the first example above you can actually set a ”face” to a number. Imagine that you have 100 customers and you can actually know who is who. By using the VisitorID you can know how ”Joel” is behaving on my website, or at what stage ”Jennifer” leaves my website. This varies on your database but basically the sky is your limit.
Integration of ecommerce metrics
Before you can use Google eCommerce in analytics you need to set it up. If you use some popular ecommerce platform such as Shopify, Tictail (or soon Bevace eCommerce platform (Woho!)) most have ready plugins to simply install and get this data automatically. But in many cases you have custom metrics in your website that you wan’t to analyse.
For the most starter user it’s enough with Google Analytics tracking code which you just copy and paste into your website. But for more advanced users we need to start looking at how Google’s ecommerce tracking works:
Google Analytics ecommerce tracking is made of 3 functions:
1._addTrans()
2._addItem()
3._TrackTrans()
_addTrans
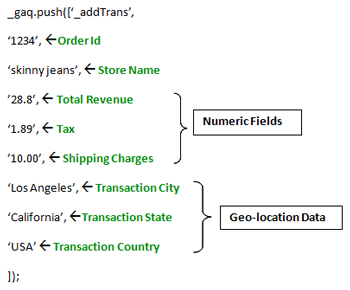
Here above we have an image of how the _AddTrans works. The green text on right side of the ”code” explains the fields.
_addItem
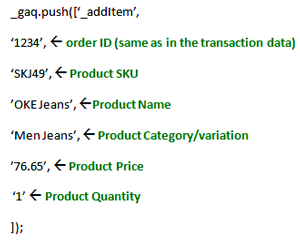
Here above we have an image of how the _addItem works. The green text on right side of the ”code” explains the fields.
_TrackTrans
_gaq.push([‘_trackTrans’]);
This code eventually sends the data to Google Analytics server.
The whole process of sending the data from your webshop to Google Analytics looks like this:
![]()
Summary
Google Analytics is almost endless and can be used for both online and offline analytics. This is the industry standard used by millions of small and big companies. Remember that all this data is useless if you don’t ask it questions and pull clear insights from it. That’s why you always should start by having a clear goal with your website and after that ask questions to pull specific data that can give you real insights you turn into actions. There are several other tools which can be used as complementary to Google Analytics and a few examples are Form Analytics http://www.formisimo.com/ and https://www.optimizely.com/ for A/B testing.
Hope you enjoyed my Google Analytics Guide for Beginners and stay tuned for the Google Analytics for Advanced users.
Ending with a industry quote from Google: ”Many businesses use data to support their decisions instead of drive their actions. But why? After all, data is really only valuable if you can translate it into actionable insights. Gaining these insights starts with figuring out what you want from your data—finding its value.”
How can I help you?
If you need help with digital marketing and analytics please don’t hesitate to contact me at Joel.tukiainen@bevace.se or call us at +46(0)8-559 26 039 – leave a message and we’ll get back to you.
/ Joel Tukiainen
CEO & Project Manager – Bevace Media AB
Digital Data Strategist Student – Hyper Island
Continue reading our Digital Marketing & Analysis Series
1) Google Analytics for Beginners
2) Search Engine Optimization (SEO) For Beginners
3) Google Adwords (PPC) For Beginners
2 reaktioner på ”Google Analytics Guide For Beginners”
Kommentarer inaktiverade.


this is a test only
this is for test purpose